Net Zero Industrial Policy Lab · Johns Hopkins SAIS Atlas of the Global
Clean Industrial Base
INTERNAL
Net Zero Industrial Policy Lab · Johns Hopkins SAIS PHASE II · 2026

Atlas of the Global
Clean Industrial Base

Trade-based intelligence platform mapping global value chains of clean technologies. 11 technologies · 200+ countries · 1995–2024.

11
Technologies
440
HS6 products
155
PC countries
1995–2024
BACI coverage
Table-first · BACI

Data Explorer

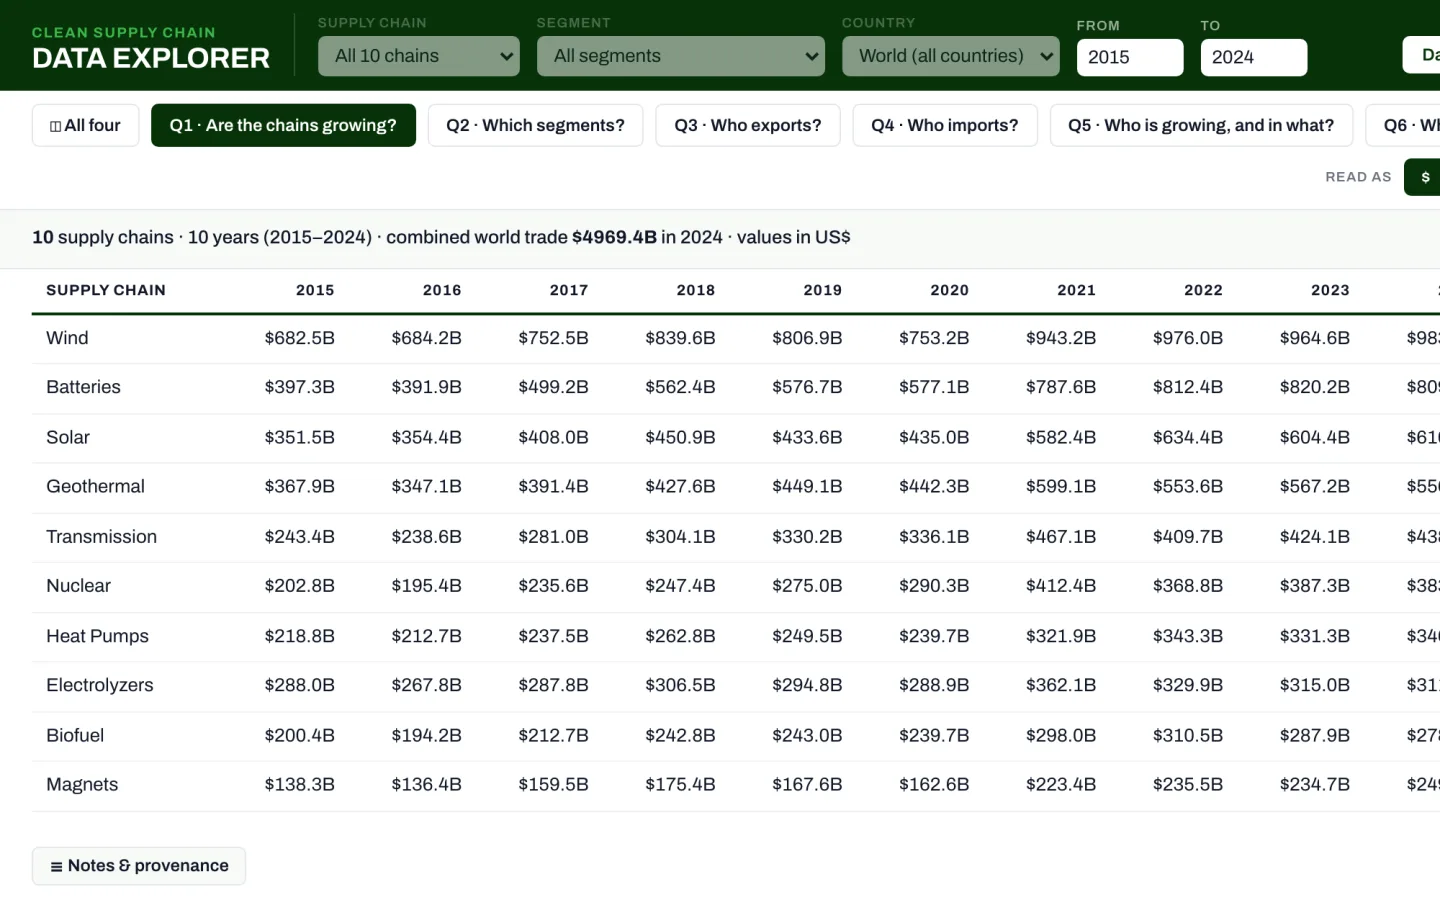
Raw trade data as a table. HS-6 codes with official BACI descriptions, every ratio shown beside the values it was computed from, and CSV/XLSX export of exactly what is on screen. A Raw | Corrected control restates every number for multi-use, and Q6 shows where each chain narrows to a few exporters.

6 views · 16 pre-aggregated slices
Page updated 16 Sep 2026 · data 22 Sep 2026
Parse the world trade data of the clean industrial base: which chains are growing? Which are shrinking? And in what positions along the value chain? →
Chain-first cockpit

Clean Supply Chain Navigator

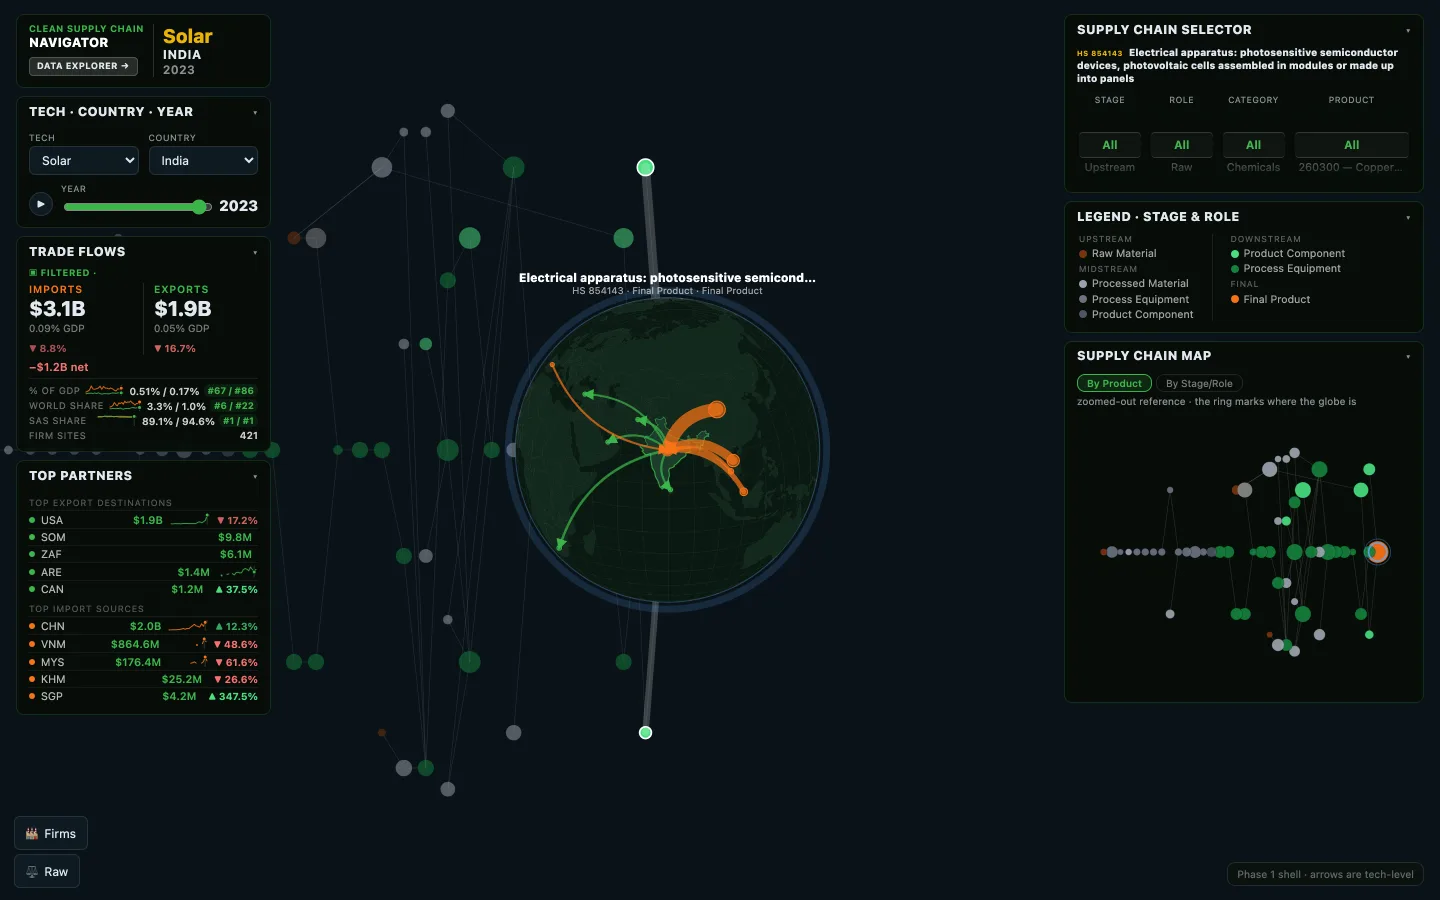
The production chain is the stage and the globe sits inside the selected node — the focus country on the world map, its domestic S&P firm activity inside, trade arrows to its top sources and destinations. Click a chain neighbour to walk the chain: the arrows, headline totals and readout all switch to that HS code alone, not the whole technology. Read it by product or by stage and role, and the whole cockpit follows.

297 country × technology cases · per-product partner flows
Page updated 24 Sep 2026 · data 23 Sep 2026
Navigate along the global flows of clean trade through their supply chains: what are the top importers? And top exporters? →
World · Country · Tech

Atlas Plates

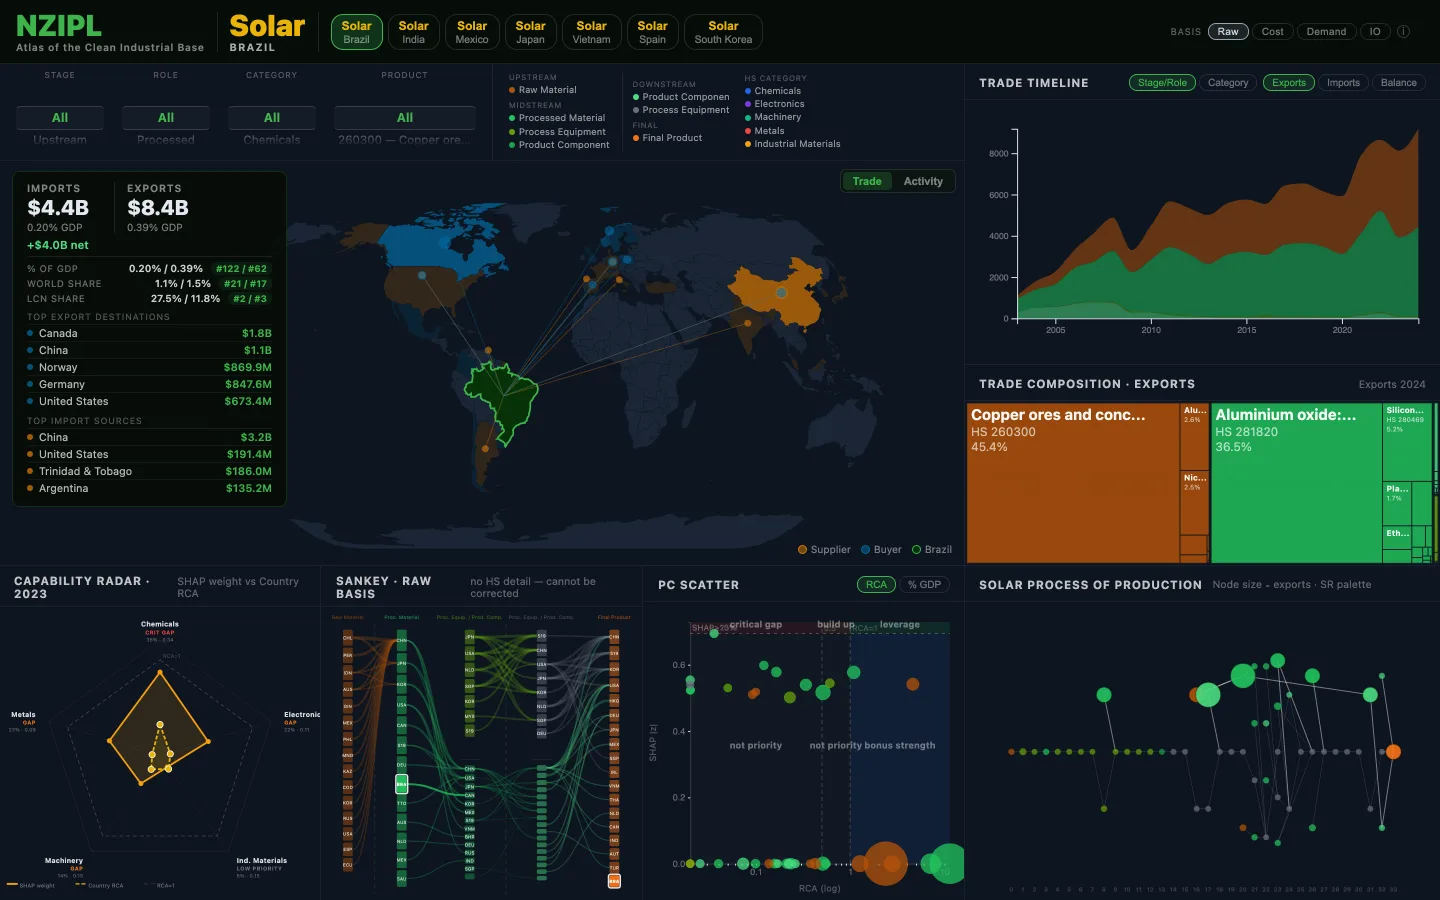
Full-page compiled plates: trade map, value-chain timeline, product treemap, capability radar, sankey decomposition, PC scatter and firm activity, all on one spread. Offline-capable — D3 and the world atlas are inlined.

2 world · 7 country · 20 tech plates
Page updated 24 Sep 2026
Visualize a dashboard of trade and production statistics →
One pair, every visual

Deep Dives

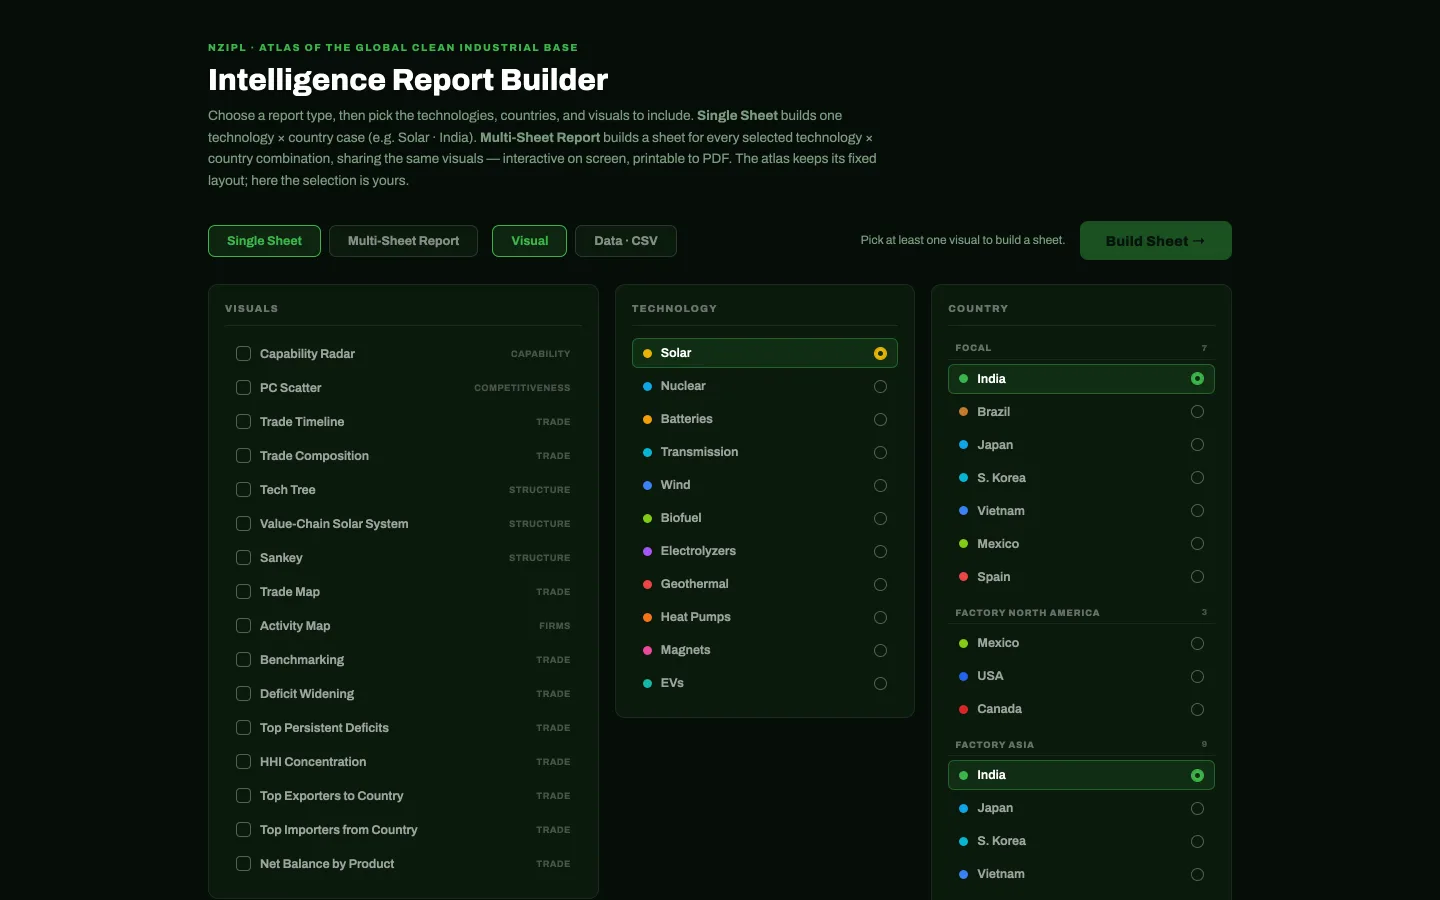
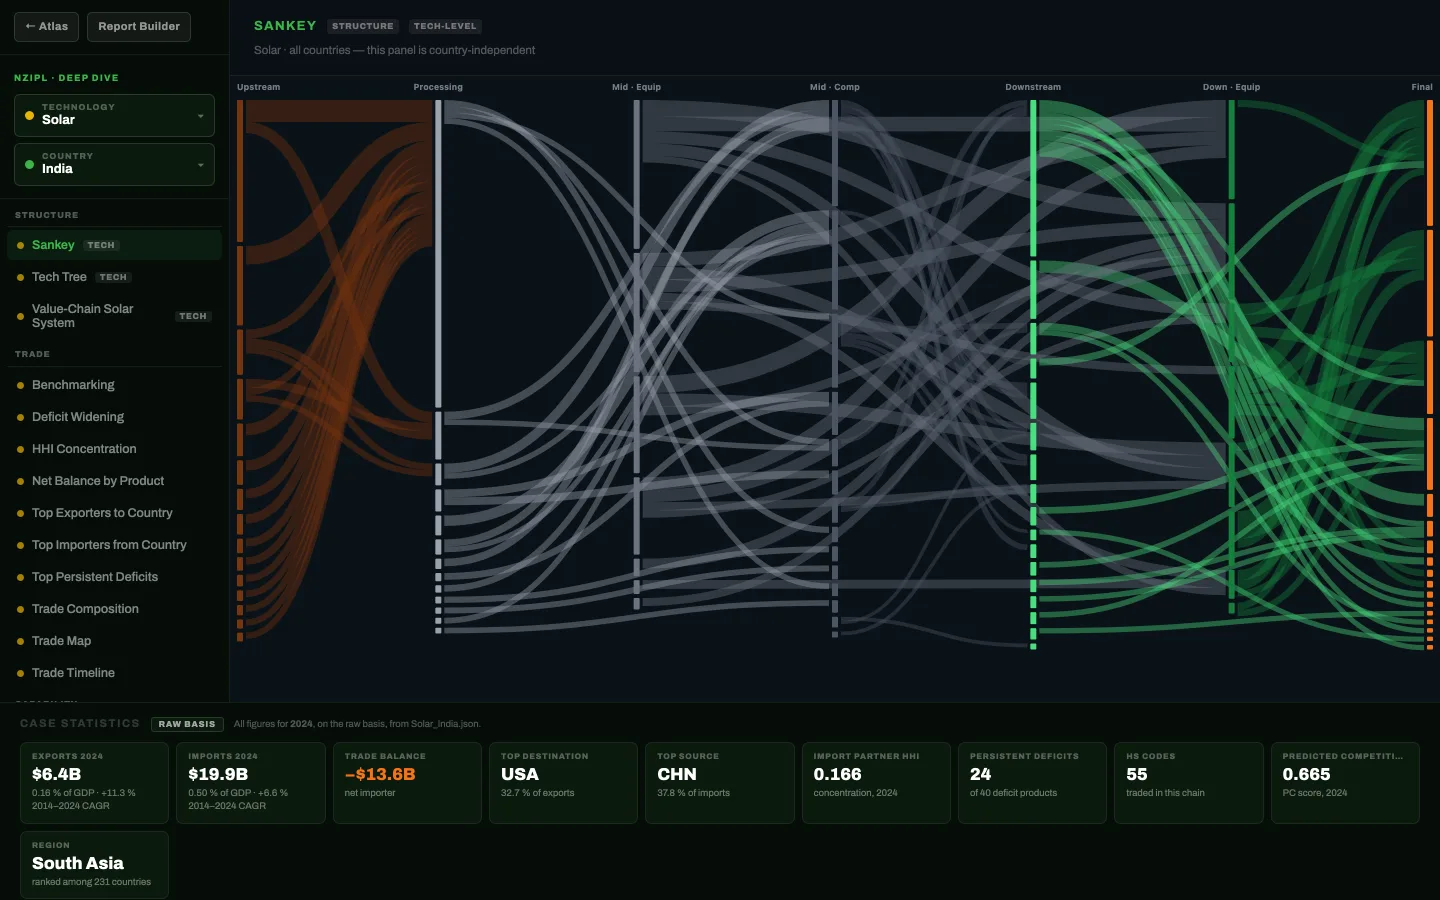
Fix a country and a technology, then move through every visual the project can draw for that pair — trade, structure, capability, competitiveness and firms — in the intelligence-report layout. Switch either half of the pair inside the report itself. Where a panel is not offered, the rail says why.

16 modules × 297 cases
Page updated 23 Sep 2026 · data 23 Sep 2026
Deep Dive on the data on a specific country and tech →
Panel by panel

Visual Module Browser

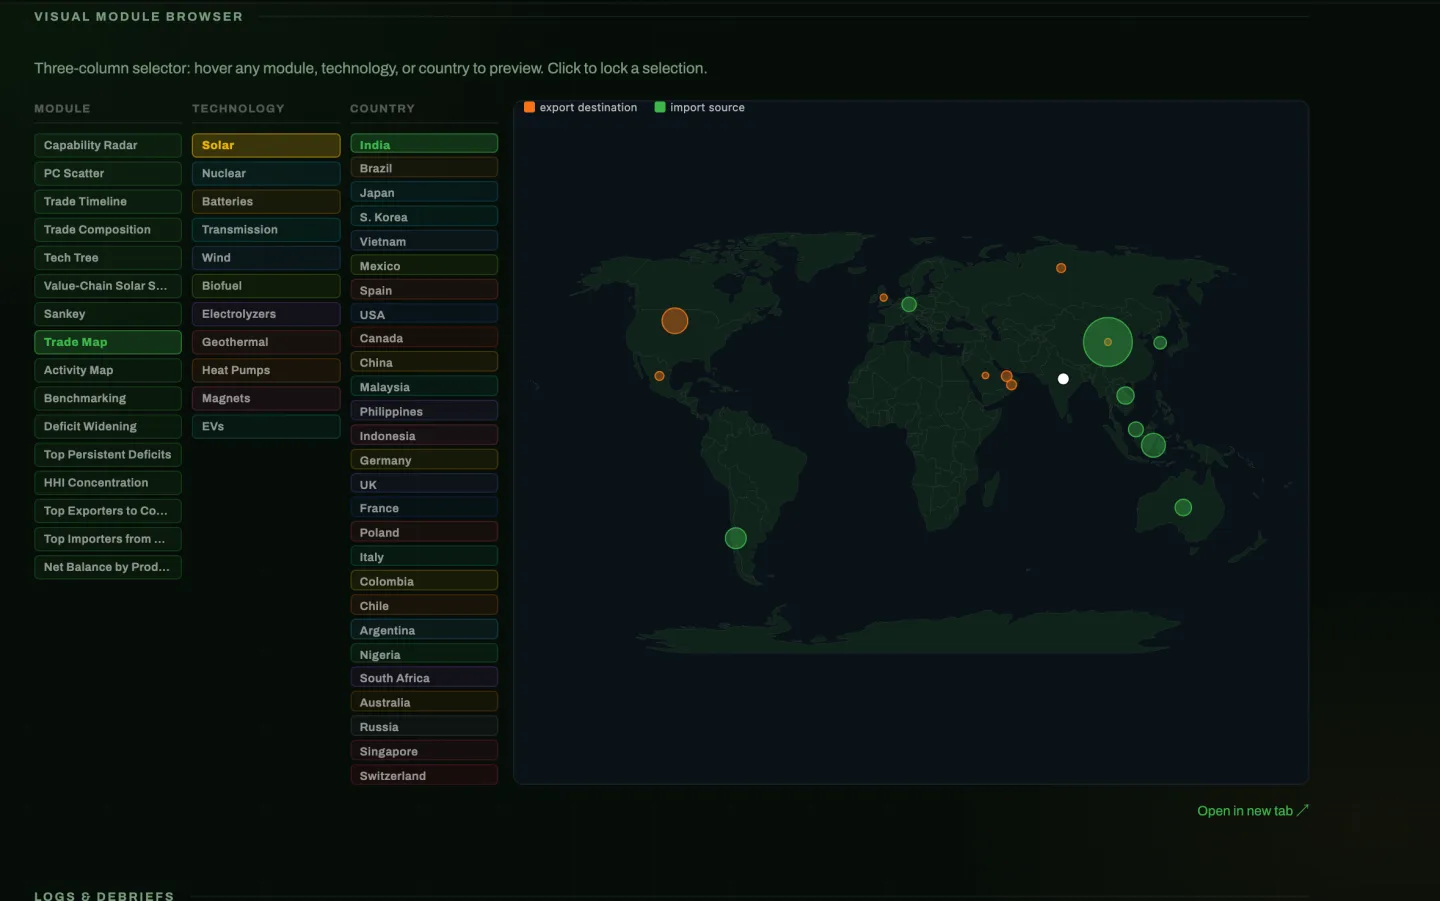
One visual at a time, across every combination. Hover any module, technology or country to preview it in place; click to lock the selection. Every panel renders live through the shared engine rather than from a pre-built file.

9 modules × 11 techs × 27 countries
Page updated 23 Sep 2026 · data 23 Sep 2026
Explore the visualization portfolio for 27 core countries →